Notes on data that actually behaves
The stuff that causes problems — duplicate records, formatting disasters, missing values, outliers that wreck your averages — and how to fix them.

RevOps Best Practices: Building a Revenue Operations Function That Actually Works
Proven RevOps best practices from alignment to tech stack. How to structure your revenue operations function, avoid common mistakes, and drive real results.

AI-Powered Data Cleaning: How Machine Learning Catches What Rules Miss
Semantic matching catches duplicates rule-based tools miss. How AI data cleaning works, when to trust it, and what to look for in a tool.

Email List Hygiene: Stop Emailing Dead Addresses
High bounce rates tank your sender reputation and your deliverability. Here's how to find dead addresses, clean your list, and keep it healthy over time.
Data Cleaning for Finance Teams: Catching Expensive Errors Early
How finance teams catch costly data errors early — reconciliation gaps, duplicate vendors, and formatting mistakes that quietly distort reports and forecasts.

Governance Without the Headache: Lightweight Controls for SMBs
Lightweight data governance for SMBs — practical controls that keep your CRM clean without heavy process, big tooling, or a full-time data team.

Real-Time vs Batch Data Cleaning: When to Use Each
Should you clean data as it arrives or in scheduled batches? Here's how to decide—and when to do both.

Semantic Duplicate Detection: A Gentle Intro to Embeddings
A gentle intro to semantic duplicate detection with embeddings — how AI spots duplicates that fuzzy matching misses, explained without the math headache.

Address Standardization: The Hidden Complexity of Location Data
123 Main St, 123 Main Street, and 123 Main ST are the same address. Getting your systems to agree is another story.

Building a Data Quality Culture (Without Becoming the Data Police)
You can't guilt people into better data entry. Learn how to build a data quality culture through visibility, smart incentives, and automation.

Data Deduplication Strategy: Before, During, and After the Merge
Deduplication isn't a one-time event. Here's how to handle duplicates at every stage—from prevention to detection to merge.

Email Validation the Right Way (Without Nuking Good Leads)
How to validate email addresses without deleting good leads. Catch typos and dead inboxes while protecting deliverable contacts and your sender reputation.

From Spreadsheet to Single Source of Truth: A No‑Code Workflow
Turn scattered spreadsheets into one clean, unified dataset without code. A practical workflow for data cleaning, preview controls, audit trails, and governance.

International Phone Numbers: From Chaos to E.164
Master E.164 phone formatting for CRM data cleansing. Country code examples, a data cleaning checklist, and best practices for international contact data.

The CRM Migration Checklist: Cleaning Data Before the Move
Moving CRMs? The data you bring determines whether the new system works. Here's what to clean before you migrate.

Why Your Data Validation Failed (And What to Do About It)
Your validation rules rejected good data or let bad data through. Here's how to troubleshoot and fix your validation logic.
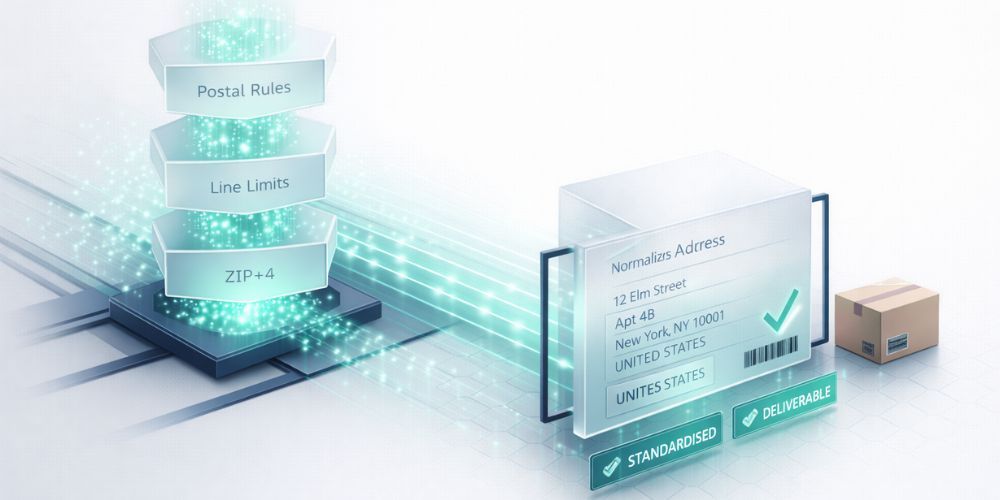
Address Normalization That Doesn’t Break Shipping
Learn how to normalize addresses without dropping apartment numbers, breaking international formats, or creating returns.

Customer Data Cleaning: How to Clean Your CRM Without Breaking Everything
Step-by-step guide to cleaning customer data in your CRM. Find duplicates, fix formatting, fill gaps without losing critical records. Practical tips inside.

How to Measure Data Quality: Building a Clarity Scorecard
Build a 0-100 Clarity Score to measure data quality. Covers completeness, consistency, duplicates, anomalies—plus a scorecard template.

Shopify + Salesforce + HubSpot: A Practical Guide to Unified Customer Data
How to merge customer records from Shopify, Salesforce, and HubSpot into one clean dataset. Field mapping examples and identity resolution tips.

The 2026 Buyer’s Guide to Data Cleaning Tools
Cut through the marketing noise. Learn the five capabilities that actually matter when evaluating data cleaning tools, plus a ready-to-use RFP checklist.

The Data Trust Playbook for RevOps Leaders
A practical playbook for RevOps leaders: roles, rituals, templates, and a quarterly roadmap to build data trust across your organization.

When Excel Mangles Your Dates: A Survival Guide
Excel turned your dates into five-digit numbers again. Here's how to fix the damage and prevent it from happening next time.

Anomaly Detection for Business Data: From Quick Rules to ML
Learn when simple rules suffice and when ML pays off. Spot outliers, cut false positives, and protect decisions with CleanSmart’s LogicGuard.

CSV Files: The Good, The Bad, and The Messy
CSVs are everywhere—and so are their problems. Encoding nightmares, Excel date mangling, delimiter chaos. Learn what goes wrong and how to fix it.

CSV Validation Rules Every Team Should Enforce
Stop catching CSV errors after they've already broken something. These validation rules prevent bad data from getting into your system in the first place.

Data Cleaning Checklist: 10 Things to Check Before Your Next Analysis
A 10-point data cleaning checklist to run before your next analysis — catch duplicates, missing values, formatting errors, and outliers before they skew your results.

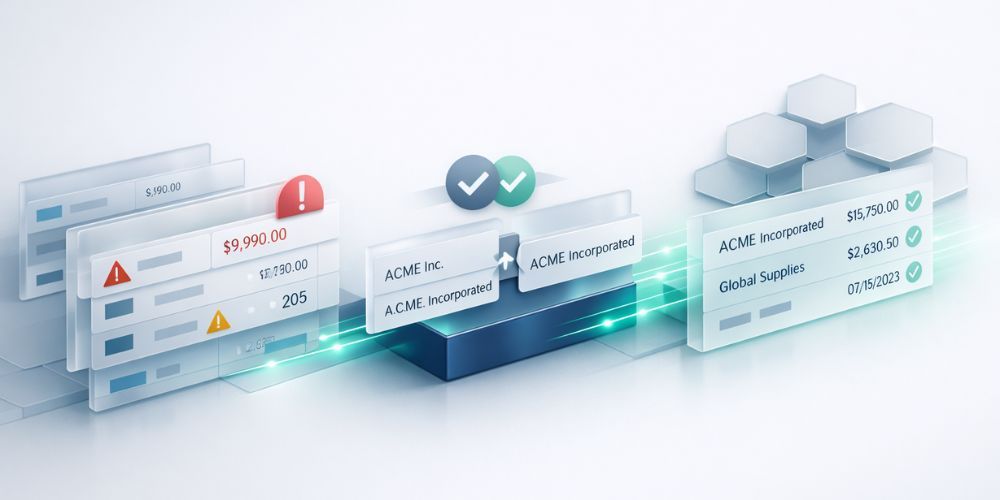
Duplicate Detection: Why Fuzzy Matching Isn't Enough
Fuzzy matching misses duplicates that semantic AI catches. Learn why "Jon Smyth" and "Jonathan Smith" slip through traditional deduplication—and how to fix it.

Missing Data Imputation: When to Fill, When to Flag
A practical guide to missing data: when to impute and when to flag. Boost data trust with SmartFill confidence scores for cleaner, reliable analytics.

Phone Number Formatting
Your CRM has the same phone number stored 47 different ways. Here's why that happens and how to fix it permanently.

The True Cost of Dirty Data (And How to Fix It)
The cost of bad data is wasted spend, missed deals, and broken trust. Learn how to quantify it, stop duplicates, standardize, and build a lasting fix.