Last month, a client called in a panic. Their quarterly report showed a customer with a lifetime value of negative $47 million. Obviously wrong. But it had already been in three presentations before someone noticed.
That's the thing about bad data—it doesn't announce itself. It sits there looking like every other row until it wrecks an average, skews a forecast, or embarrasses someone in front of the board.
Anomaly detection sounds technical, but it's really just systematic suspicion. Instead of hoping someone catches the weird stuff, you build checks that catch it automatically. This post covers how to do that, starting with simple rules you can implement today and working up to machine learning approaches for when the patterns get complicated.

Outliers vs. Anomalies: A Useful Distinction
These words get used interchangeably, but the difference matters.
An outlier is a value that's statistically unusual. It's far from the mean, outside the normal distribution, numerically distant from its neighbors. Outliers are math.
An anomaly is a value that shouldn't exist given what you know about the domain. A 200-year-old customer. An order placed before the company existed. A negative quantity shipped. Anomalies are logic.
Some outliers are anomalies (that $47 million negative LTV). Some aren't—your highest-paying customer is an outlier, but they're real and you definitely want to keep that record. Some anomalies aren't even outliers; a birth date of January 1, 1900 is suspicious not because it's statistically extreme but because it's the default date in too many systems.
Effective detection catches both. You need statistical methods for the outliers and business rules for the anomalies.
Fast Wins: Z-Scores and IQR
Let's start with the approaches you can implement in a spreadsheet.
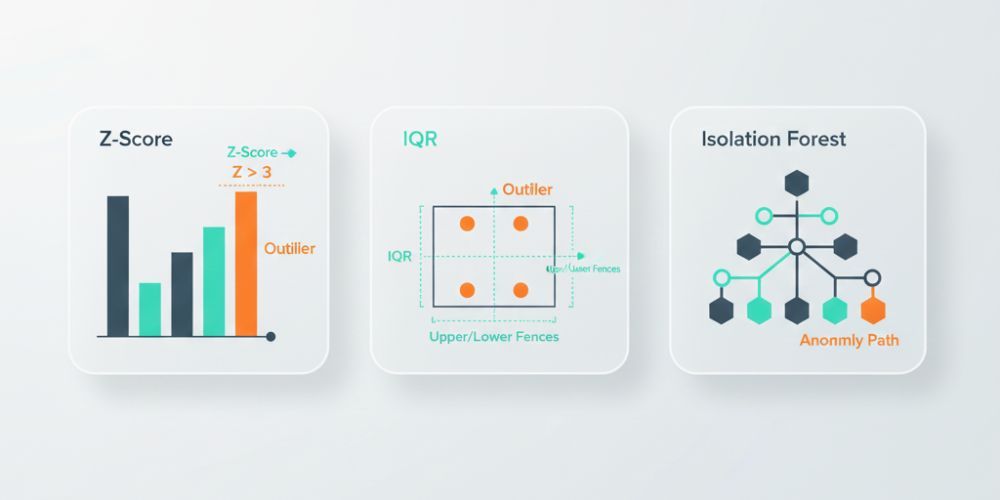
Z-score measures how many standard deviations a value is from the mean. A z-score of 0 means exactly average. A z-score of 2 means two standard deviations above average. Most real-world data clusters within 2-3 standard deviations of the mean, so values beyond that threshold are worth investigating.
The formula is straightforward: (value - mean) / standard deviation.
In practice, you'd flag anything with an absolute z-score above 3 as suspicious. That catches roughly the most extreme 0.3% of values in a normal distribution. Adjust the threshold based on your tolerance for false positives—lower catches more but flags more legitimate values too.
Z-scores have a weakness: they assume your data is roughly normally distributed. If you've got heavy skew (like income data, where a few high earners pull the mean way up), z-scores will miss low-end anomalies while over-flagging the high end.
Interquartile Range (IQR) handles skewed data better. Instead of mean and standard deviation, it uses medians and quartiles.
Quick refresher: Q1 is the 25th percentile, Q3 is the 75th percentile, and IQR is the distance between them (Q3 - Q1). The standard rule flags values below Q1 - 1.5×IQR or above Q3 + 1.5×IQR as potential outliers.
IQR is more robust to extreme values because medians don't get pulled around the way means do. It's a better default for business data, which is almost never normally distributed.
Rule-Based Guards: The Stuff Algorithms Can't Know
Statistical methods catch values that are numerically weird. They don't catch values that are logically impossible.
That's where business rules come in. These are explicit checks based on domain knowledge:
- Range checks: Age must be between 0 and 120. Order totals must be positive. Percentages must be between 0 and 100.
- Format checks: Phone numbers should have the right number of digits. Email addresses need an @ symbol. Dates should be parseable.
- Cross-field consistency: Ship date can't be before order date. End date can't be before start date. Discount can't exceed the original price.
- Referential integrity: Customer IDs should exist in the customer table. Product codes should match your catalog.
These rules feel obvious, but that's exactly why they're valuable. The data entry person who typed "13/25/2024" because they swapped month and day wasn't trying to break anything. The system that imported a test record with "$0.00" for every field wasn't malicious. Without explicit guards, this stuff slips through.
Write down the rules that would make you say "that can't be right" if you saw the data. Then automate the checking.
Seasonality and Context
Here's where things get trickier. Some values are only anomalous in context.
A retail business doing $50,000 in daily sales is normal in December, suspicious in February. An order for 10,000 units from a customer who usually orders 100 is either a data entry error or your best day of the quarter—you can't tell from the number alone.
Contextual anomaly detection means comparing values to the right baseline:
- Time-based context: Compare to the same period last year, the same day of week, the trailing average. A 50% spike looks different when last Tuesday also had a 50% spike vs. when sales have been flat for months.
- Segment-based context: Compare to similar entities. A 10-person company with $5M in revenue is impressive; for a 5,000-person company, it suggests something's wrong with your data.
- Trend-based context: Gradual growth is normal; sudden jumps warrant investigation. A customer whose spending increases 10% monthly for a year is on a trajectory; a customer whose spending jumps 400% in one month needs a second look.
This is where simple threshold rules start to struggle. You need either a lot of conditional logic or smarter methods.
Machine Learning: Isolation Forest in Plain English
When your data has many dimensions and the patterns are hard to specify in rules, machine learning can help. The most accessible method for anomaly detection is called Isolation Forest.
The intuition is simple: anomalies are easier to isolate than normal points.
Imagine you're playing 20 questions to identify a specific data point. For a point that's similar to lots of others, you need many questions to narrow it down. For a point that's unusual, you can isolate it quickly.
Isolation Forest formalizes this. It builds random decision trees that split the data, then measures how many splits it takes to isolate each point. Points that get isolated quickly (short path length) are flagged as potential anomalies.
The advantages: it works on high-dimensional data, doesn't assume any particular distribution, handles mixed numeric and categorical features, and scales well to large datasets.
The disadvantages: it's a black box, it requires labeled examples or manual review to tune, and it can flag legitimately unusual-but-valid records.
You don't need to implement this from scratch. Libraries like scikit-learn make it a few lines of code, and tools like LogicGuard apply it automatically with sensible defaults.
Choosing Thresholds Without Drowning in False Alarms
Every detection system faces the same trade-off: catch more anomalies, get more false positives.
Too sensitive, and your team ignores the alerts because they're usually nothing. Too lenient, and the real problems slip through. Finding the right balance requires iteration.
Start with a baseline. Run your detection rules on historical data where you know the ground truth. How many of the flagged records were actually problems? How many real problems got missed?
Then adjust. If you're drowning in false positives, tighten the thresholds. If known-bad records are getting through, loosen them or add new rules.
A few practical tips:
Tiered severity works better than binary flags. Instead of "anomaly yes/no," use "critical / warning / info." Reserve automatic rejection for truly impossible values (negative ages, dates in the year 3025). Use warnings for statistical outliers that need human review. Log everything else for pattern analysis.
Review false positives regularly. When you dismiss a flagged record as legitimate, ask why it was flagged. If a particular rule generates lots of false alarms, it needs tuning or context.
Track your hit rate. What percentage of flagged records turn out to be real problems? If it's below 20%, your thresholds are too loose. If it's above 80%, you might be missing things—you've only tuned for the obvious cases.
LogicGuard in Practice
CleanSmart's LogicGuard combines statistical detection with business rule validation. When you upload a dataset, it automatically:
- Runs statistical checks on every numeric column—z-scores, IQR, distribution analysis. Values that fall outside normal ranges get flagged with severity levels based on how extreme they are.
- Applies format validation to detected field types. Emails get validated, phone numbers get checked against expected patterns, dates get parsed and sanity-checked.
- Checks cross-field consistency where relationships are detectable. If you have "start_date" and "end_date" columns, it verifies that end dates come after start dates.
- Flags impossible values based on common business rules. Negative quantities, percentages over 100, ages outside reasonable bounds.
Everything flagged gets categorized by severity and type. You can review anomalies individually, accept or dismiss them, or set up rules to auto-handle specific patterns in future uploads.
The goal isn't to replace human judgment—it's to focus human judgment on the records that actually need it.
Anomaly Triage Checklist
When you find a flagged value, work through this:
- Is it impossible or just unusual? Impossible values (negative ages, future birth dates) are always errors. Unusual values need investigation.
- Can you verify against a source? Check the original form, the upstream system, or the customer record. Sometimes the anomaly is in your data; sometimes it's real.
- Is there a pattern? One weird record is a typo. Ten weird records from the same source is a systemic issue.
- What's the downstream impact? A wrong email address is annoying. A wrong financial figure could be material.
- Fix, flag, or delete? If you know the correct value, fix it. If you're uncertain, flag it for follow-up. If it's garbage with no recovery path, delete it—but log what you removed and why.
Start Scanning
Upload a CSV to CleanSmart and let LogicGuard run. You'll get a report showing every statistical outlier, format violation, and logic failure in your dataset—categorized, prioritized, and ready for review. No setup, no configuration, no statistics degree required.
What's a good starting threshold for z-score anomaly detection?
Start with an absolute z-score of 3 as your threshold, which flags values more than three standard deviations from the mean. This catches approximately the most extreme 0.3% of values in normally distributed data. If you're getting too many false positives, raise it to 3.5 or 4. If obvious problems are slipping through, drop it to 2.5. The right threshold depends on your data and your tolerance for manual review—there's no universal answer, just a starting point for iteration.
Should I remove outliers from my dataset?
Not automatically. Outliers are unusual, but unusual isn't the same as wrong. Your highest-value customer is an outlier. A viral sales day is an outlier. Removing them would remove real, important information. The question is whether the outlier represents valid data or an error. Investigate first, then decide. If it's a data entry mistake, fix or remove it. If it's legitimate but distorting your analysis, consider analyzing with and without the outlier to understand its impact, or using robust statistics (like median instead of mean) that aren't as affected by extreme values.
How is anomaly detection different from data validation?
Data validation checks whether values meet predefined rules—format requirements, allowed ranges, required fields. It's binary: valid or invalid. Anomaly detection looks for values that are statistically unusual or contextually suspicious, even if they technically pass validation. A customer age of 847 would fail validation (out of allowed range). A customer age of 6 would pass validation but might be flagged as anomalous for a B2B SaaS product. You need both: validation catches the obviously wrong, anomaly detection catches the subtly weird.