Missing data shows up in every dataset eventually. Someone skips a form field. An integration hiccups. A column that used to be optional becomes required. Whatever the cause, you're now staring at gaps in your spreadsheet and wondering what to do about them.
The instinct is to fill everything. Get the blanks out of there. Make the dataset "complete." But here's the thing—filling missing values is a form of making stuff up. Sometimes that's fine. Sometimes it's reckless. The difference comes down to understanding what you're doing and why.
This post walks through the common approaches to handling missing data, when each one makes sense, and when you should leave well enough alone.

The Basic Approaches (And Their Limits)
Most imputation methods fall into a few categories. None of them are magic.
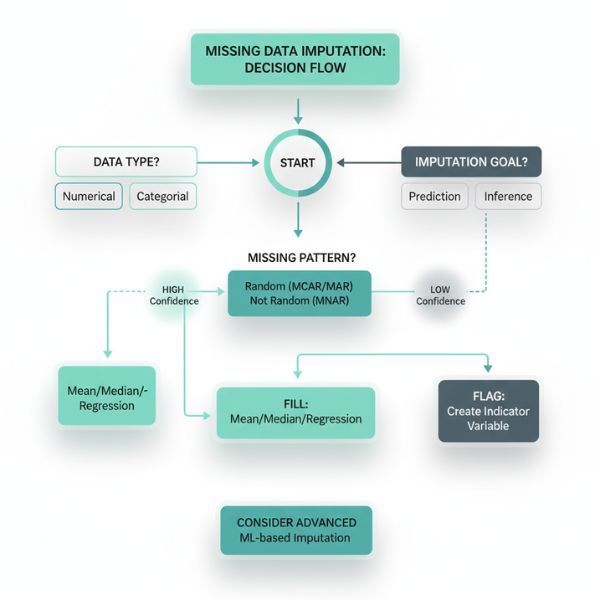
Mean/Median/Mode is the default for a reason—it's simple and it works for a lot of cases. Missing age? Use the average age. Missing category? Use the most common one. The problem is obvious: you're flattening variation. If your dataset has meaningful outliers or subgroups, shoving the average into every gap erases information you might need later.
Forward fill and backward fill make sense for time series data. If yesterday's stock price is missing, using the day before is reasonable. But this assumes continuity that doesn't always exist. A sensor that went offline for a week probably wasn't reading the same value the whole time.
Regression-based imputation gets fancier—predicting missing values from other columns. If you know someone's job title and department, you can make a decent guess at their salary range. This works well when columns are genuinely correlated. It falls apart when they're not, or when the relationship is more complicated than a linear model can capture.
K-nearest neighbors takes the "find similar records" approach. What did other people with similar attributes have in this field? It's more sophisticated than simple averages, but it's also slower and can be thrown off by how you define "similar."
None of these methods are wrong. They're just tools with trade-offs.
Context Matters More Than Method
The real question isn't "which algorithm should I use?" It's "what is this field, and what happens downstream if I guess wrong?"
A missing zip code on a marketing contact? Fill it if you can, flag it if you can't—nobody's going to jail over a misdirected postcard. A missing dosage on a medical record? Don't touch it. Ever. Let a human figure that out.
Between those extremes is where judgment comes in.
Ask yourself:
How will this field be used? If it feeds a report that executives glance at quarterly, the stakes are different than if it drives automated decisions. Imputed values in a machine learning training set can propagate errors in ways that are hard to trace later.
What's the missing pattern? Data that's missing at random is safer to fill than data that's missing for a reason. If all your high-income customers skipped the income field, imputing the median income will systematically undercount your best customers. That's not a gap—it's a bias you're baking in.
How much is missing? A column that's 5% empty is a different problem than one that's 60% empty. At some point, you're not filling gaps—you're fabricating a column.
Confidence Scoring: Know What You're Guessing
The smartest imputation systems don't just fill values—they tell you how confident they are. A prediction based on five highly correlated fields is more trustworthy than one based on a single weak signal.
Confidence scoring turns imputation from a black box into something you can evaluate. Instead of "we filled 847 missing values," you get "we filled 623 values with high confidence, 189 with medium confidence, and flagged 35 for review."
This matters for governance. When someone asks "where did this number come from?" you need a better answer than "the computer guessed." Confidence scores let you set thresholds: auto-fill anything above 85% confidence, flag everything else for human review.
SmartFill™ takes this approach. Every imputed value comes with a confidence score and an explanation of which fields contributed to the prediction. You can accept fills in bulk above your threshold and review the uncertain ones individually. Nothing changes without your approval.
When to Flag Instead of Fill
Sometimes the right move is to leave the gap and mark it clearly. Fill with a placeholder like "MISSING" or "NEEDS_REVIEW" rather than a fake value that looks real.
Flag instead of fill when:
The field is high-stakes. Financial amounts, medical data, legal identifiers. If getting it wrong causes real harm, don't guess.
The missing pattern suggests a problem. If a particular source or time period has way more gaps than normal, that's a data quality issue to investigate, not paper over.
You can't explain the fill. If you wouldn't be comfortable telling a stakeholder "we estimated this based on X, Y, and Z," then you shouldn't be estimating it silently.
The downstream system can handle nulls. Many analytics tools and databases work fine with missing values. Forcing completeness where it isn't needed creates false precision.
Flagging isn't giving up. It's acknowledging uncertainty instead of hiding it.
Audit Trails and Reversibility
Here's where a lot of data cleaning goes wrong: you fill values, save the file, and now there's no way to tell which values were original and which were imputed.
Any serious imputation workflow needs to track what changed. At minimum, you want to know which records were modified, what the original value was (including null), what the new value is, when the change happened, and what method or rule produced it.
This isn't bureaucracy—it's insurance. When someone questions a number six months from now, you can trace it back. When you discover a bug in your imputation logic, you can identify which records were affected.
Reversibility matters too. Can you undo a batch of fills if they turn out to be wrong? If your workflow overwrites the source file with no backup, you're one bad decision away from corrupted data with no recovery path.
CleanSmart keeps a full transformation log for every cleaning job. Every fill, every merge, every format change—recorded and reversible. Your original file stays untouched until you explicitly export the cleaned version.
A Practical Decision Framework
Pulling this together into something actionable:
Step 1: Assess the field. What is it? How is it used? What's the cost of a wrong guess vs. a gap?
Step 2: Check the missing pattern. Is it random or systematic? How much is missing?
Step 3: Choose your approach. Simple statistics for low-stakes, well-distributed gaps. Context-aware prediction for fields with strong correlations. Flagging for high-stakes or unexplainable cases.
Step 4: Set confidence thresholds. Auto-accept high confidence fills. Route medium confidence for review. Reject or flag low confidence.
Step 5: Document everything. Log what changed, why, and when. Keep the original data accessible.
This isn't a one-time decision. As your data changes, your imputation strategy might need to change too. A field that was reliably filled six months ago might start showing gaps from a new data source with different collection practices.
Try It On Your Own Data
If you're dealing with missing values right now, upload a sample CSV to CleanSmart. SmartFill™ will analyze your gaps, suggest fills with confidence scores, and let you review everything before applying changes. You keep full control, and the audit trail means you can always explain—or undo—what happened.
What's the difference between imputation and interpolation?
Interpolation specifically estimates missing values between known points, usually in time series or spatial data—like guessing Wednesday's temperature when you have Tuesday and Thursday. Imputation is the broader term for any method of filling missing values, whether that's averaging across a column, predicting from other fields, or using nearest neighbors. Interpolation is one type of imputation, but imputation includes techniques that don't assume ordered or continuous data.
Should I impute missing values before or after splitting my data for machine learning?
After. If you impute on the full dataset before splitting, information from your test set leaks into your training set through the imputation statistics (like the mean you calculated). This inflates your model's apparent performance. Calculate imputation parameters on your training set only, then apply those same parameters to your test set. It's an easy mistake to make and a hard one to catch later.
How do I handle missing values in categorical fields?
You've got a few options. Mode imputation (most frequent category) is the simplest but has the same flattening problem as mean imputation for numbers. You can treat "missing" as its own category—sometimes the absence of a value is informative. Or you can predict the category from other fields if they're correlated. The right choice depends on why the data is missing and how the field will be used. If 40% of your customers didn't answer a survey question, "Declined to answer" might be more honest than guessing.